28. Self Diffusion of Argon
This application note illustrates the calculation of the self diffusion coefficient of argon using the MedeA Diffusion module and compares the results obtained with both experimental and literature values.
Keywords: MedeA Diffusion, forcefield, molecular dynamics, MD, argon, mean squared displacement, MSD, Self-Diffusion Coefficient, D0.
28.1. Background
This application note is derived from the pioneering 1964 molecular dynamics paper by Aneesur Rahman [1]. Loup Verlet, the author of the famous Verlet integration algorithm for molecular dynamics, wrote that Rahman’s 1964 paper was the breakthrough that defined the barrier separating ‘the infeasible and the obvious’ [2]. Verlet observed that once the barrier was made clear by Rahman, the field opened up and realistic simulations using molecular dynamics became practical. Hence, the work reproduced here represents one of the first examples of applied materials simulation.
Practical simulations of diffusion are of interest because diffusion underlies critical properties for many materials and processes. Industrially important phenomena such as corrosion, electronic device aging, and gas permeability, are controlled by diffusion. Hence, the calculation of self-diffusion coefficients using atomistic simulation methods is of considerable technical interest and has been studied for many years. This application note provides an illustration of the validation of the MedeA Diffusion module and discusses some of the factors that govern the quality of these calculations.
28.2. Introduction
At the atomic level, random diffusion is caused by thermally driven jumps and collisions. Such diffusion is termed self-diffusion and is characterized by a self-diffusion coefficient for a given species, that indicates the squared distance per unit time from a given starting point reached by the average particle or molecule of that type. Random diffusion, of course, results in a distribution of cumulative displacements. Large self-diffusion coefficients indicate that a wide average distribution of particle displacements will be observed, with many particles attaining large displacements, while smaller self-diffusion coefficients indicate only modest average displacements, and tighter distributions of those displacements.
The experimental measurement of self-diffusion is challenging for many reasons. For example, in solids, it may be difficult to distinguish between bulk, surface, and grain boundary effects. In the case of fluids, achieving precise measurements, that are able to select for a given species, may also be challenging. Consequently experimental self-diffusion coefficients vary significantly depending on the methodology employed in their determination.
However, atomistic simulation may be employed to determine self-diffusion coefficients. Calculations for model systems, as shown here, generally show excellent agreement with the experimental methods. These atomistic simulation calculations also present a number of subtleties, a number of which are also summarized here.
This application note employs a model system to illustrate the agreement between experiment and simulation that may be achieved with the MedeA Diffusion module. The analysis of the sensitivity of computed properties to simulation parameters is also discussed. This illustration provides useful background information for the application of such methods to more complex systems.
28.3. Liquid Argon as a Model System
In his 1964 paper Rahman [1] described molecular dynamics calculation addressing self-diffusion in argon. Rahman employed a CDC-3600, one of the most capable computers available at the time, to simulate a liquid argon system comprising 864 argon atoms using a Lennard-Jones potential (each energy and force calculation required 45 seconds on the CDC-3600). One of the quantities of interest to Rahman was the self-diffusion coefficient, D0 , a quantity that may be obtained from a plot of the mean squared displacement as a function of time, as summarized by Equation (1),
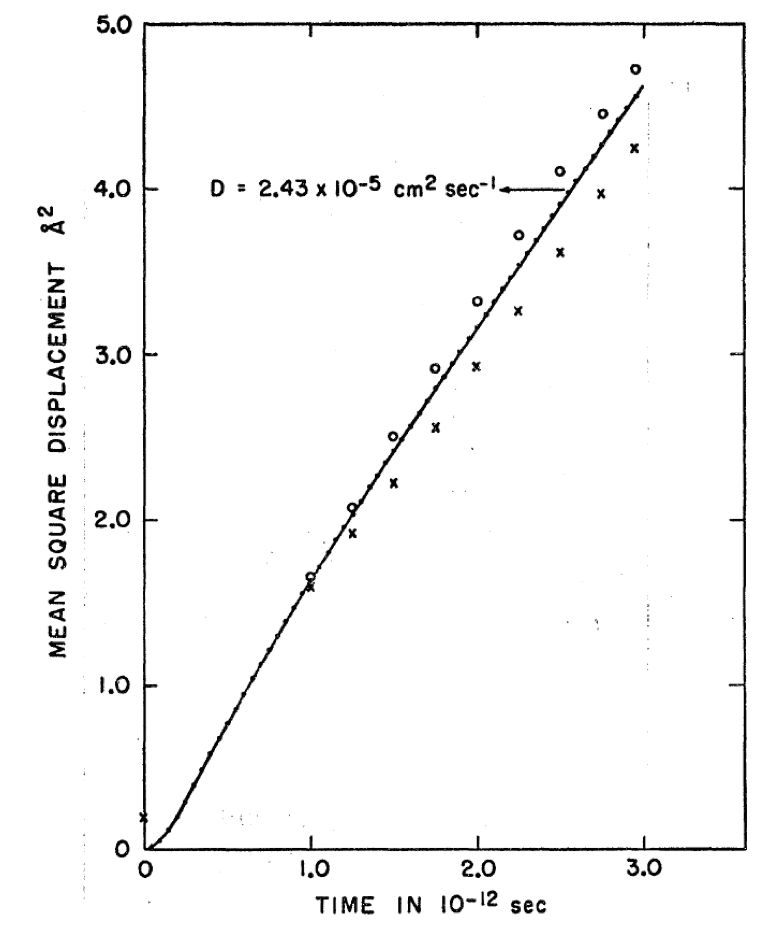
where \(<r^2>\) is the mean squared displacement of the atoms in the simulation, D0 the self diffusion coefficient, t the elapsed time, and C a constant, which for a solid is equivalent to the temperature factor of the atoms under consideration. Figure 28.4.1 shows the MSD plot from Rahman’s original paper [1].
28.4. Reproducing Rahman’s 1964 Calculation
Recreating Rahman’s pioneering calculation using the MedeA Environment and MedeA Diffusion is straightforward. The required steps are:
- Create a 1 atom argon cell
- Read the argon_rahman.frc forcefield into the MedeA Environment
- Assign forcefield types and charges for the model
- Create a new Job, and set up two variables, T=94.4K and tstep = 1fs
- Within the Job flowchart create a 10x10x10 supercell (Rahman employed 864 atoms, this MedeA simulation employs 1000 atoms)
- Set the density of the system to 1.374g/cm3
- Create a LAMMPS stage in the flowchart and set an atom based cutoff of 7.65Å (as employed by Rahman)
- Use a 10ps NVT stage to equilibrate the model
- Finally add a 3ps Diffusion stage to evaluate the self-diffusion coefficient of argon at these conditions
- Submit the calculation and collect the results from the JobServer

Figure 28.4.1 Mean square displacement (MSD) plot for argon at 94.4K and 1.374g/cm3 from Rahman 1964, taken from [1].
This calculation requires around 40s on a modest laptop, including the mean squared displacement analysis. It is interesting to observe that the entire calculation of the self-diffusion coefficient of argon can now be completed on readily available hardware in the time that was required in 1964 to compute just the energy and forces for the entire system, using a state of the art computer.
This raw increase in computational power is multiplied now by the vastly increased numbers of cores available and their decreasing cost. LAMMPS, the molecular dynamics server employed by MedeA Diffusion, is uniquely designed to exploit parallelism when necessary for large systems [3].
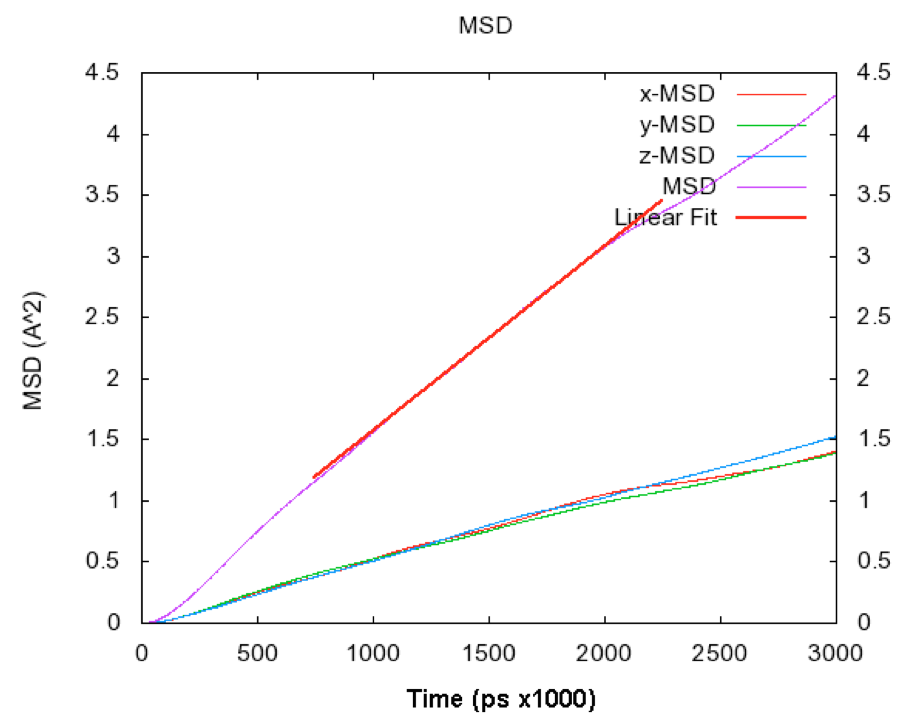
A typical mean squared displacement plot produced automatically by the MedeA Diffusion calculation is shown in Figure 28.5.1.
Although the axis scaling of Figure 28.4.1 and Figure 28.5.1 differs, it is clear that the results of the simulations are essentially identical. During the course of the 3ps trajectory, the mean squared displacement in both simulations reaches a maximum around 4.5Å2. Both figures also show an initial region where the mean squared displacement deviates from linearity, with a subsequent well behaved linear region.
Using Equation 1, the self-diffusion coefficient of argon may be computed from Figure 28.4.1 and Figure 28.5.1. This yields 2.43x10⁻⁵cm2/s [1] for the original 1964 Rahman calculation and 2.50x10⁻⁵cm2/s for the MedeA Diffusion calculation, if the central portion of the MSD plot is employed, and 2.44x10⁻⁵cm2/s, if the entire MSD plot is employed in the gradient evaluation. The experimental value quoted in [1] is 2.43x10⁻⁵cm2/s at 90K and 1.374g/cm3, hence the agreement between simulation and experiment, and between simulations separated by many decades, is good, as expected. The calculation of the self-diffusion coefficient is entirely automated by the MedeA Diffusion stage. The stage selects the central portion of the computed MSD plot, in order to avoid sampling the initial ‘ballistic’ region of the system’s mean squared displacement.
28.5. Discussion
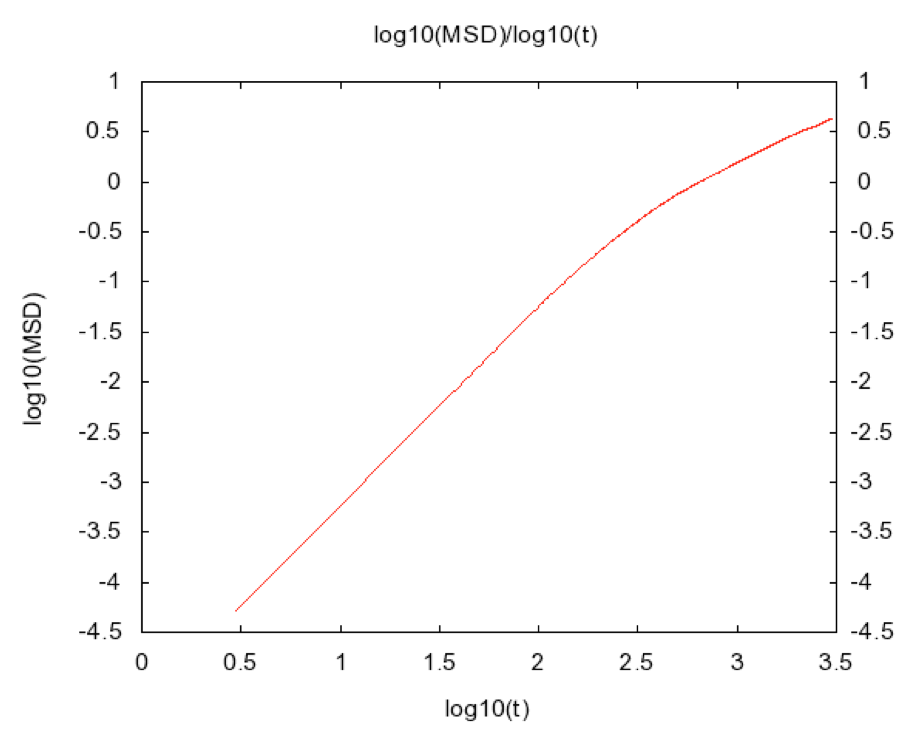
MedeA Diffusion, employing the simulation parameters used by Rahman in 1964 provides essentially identical simulation results to those reported in the original paper. The maximum mean square displacement observed in both calculations (4.5Å2) indicates that random diffusion is limited during a trajectory of 3ps. This is confirmed by the log(MSD) vs. log(t) plot of Figure 28.5.2 (that is also automatically generated by the MedeA Diffusion stage). Given Equation 1, such a log-log plot should show a constant gradient, and any deviation from such a gradient indicates that the displacement versus time relationship does not conform to the simple squared power law obtained by Einstein on the basis of his analysis of Brownian, or random, particle dynamics. Extending the trajectory duration over which the MSD is evaluated improves the sampling of random collisions, and increases the reliability of the calculation.

Figure 28.5.1 Mean square displacement (MSD) plot for argon at 94.4K and 1.374g/cm3 obtained using MedeA Diffusion. In addition to the three dimensional mean squared displacement (shown in purple) the x, y, and z component mean squared displacements are also shown (and as expected, the x, y, and z component mean squared displacements are very similar).
MedeA Environment flowcharts make the systematic exploration of calculation parameters straightforward. When computational resources permit, such sensitivity analyses provide an appreciation of the critical determinants of calculation uncertainty.
As the present example illustrates, reproducing pioneering simulations and their agreement with experiment, is straightforward employing the functionality of the MedeA Diffusion stage.
It is interesting to see how far the field that Rahman established has advanced. Rahman coded his molecular dynamics simulations in a mixture of FORTRAN and machine code, the CDC-3600 had a memory based on magnetic cores and could store about 1.5 megabytes of data in that memory. It performed about 1 million integer based computations per second, and required magnetic tape for storage of simulation results. The available memory of the CDC-3600 likely determined the number of atoms that Rahman employed. With these characteristics, the CDC-3600 was classed as a supercomputer in 1964.
Modern machines are approximately a 109 times faster in terms of numerical performance than the CDC-3600. Furthermore accessibility and usability have also improved immensely, while prices have declined. Rahman was able to provide great insights in to the origin of system properties using the CDC-3600 and modern compute resources and software make such results practical for much larger, chemically diverse systems, and for simulations that span much longer time periods.

Figure 28.5.2 log (MSD) versus log(t) for the data of Figure 28.5.1. Ideally this plot should be linear and can be used to confirm the reliability of the MSD derived diffusion coefficient information.
28.6. Modules Used in This Application
This application note employs the capabilities of the MedeA platform using the following integrated modules of the MedeA Environment:
- MedeA LAMMPS GUI
- MedeA Diffusion
- MedeA JobServer and TaskServer
| [1] | (1, 2, 3, 4, 5, 6) A. Rahman, “Correlations in the Motion of Atoms in Liquid Argon”, Phys. Rev. A 136, 405 (1964) DOI |
| [2] | L. Verlet, “The Origins of Molecular Dynamics”, in In Memoriam Aneesur Rahman, 6, J.P. Hansen, G. Ciccotti, H.J.C. Berendsen, Eds. (1987) PDF |
| [3] | S. J. Plimpton, “Fast Parallel Algorithms for Short–Range Molecular Dynamics”, J. Comp. Phys. 117, 1 (1995) DOI ; also see the LAMMPS website site: http://lammps.sandia.gov |
| download: | pdf |
|---|